
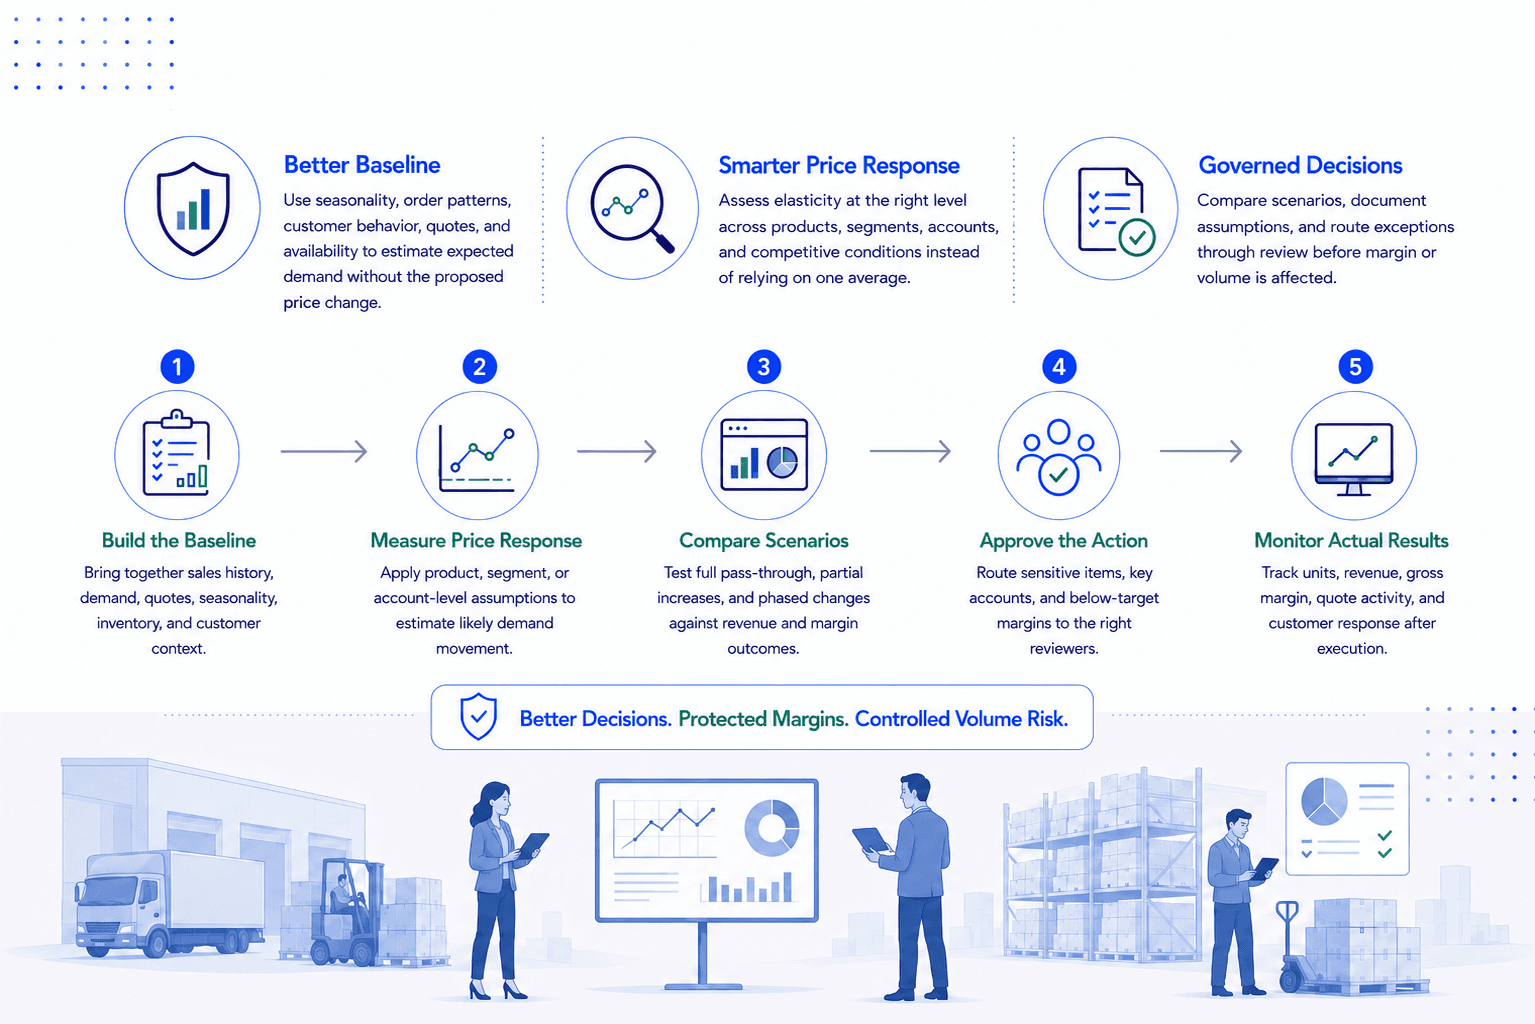
A 6% price increase can look reasonable on a category margin report and still create an avoidable volume problem. The difference is often hidden in the customer mix: a contract account with little flexibility, a competitor-sensitive segment, a slow-moving item being replaced by a substitute, or a high-volume SKU whose demand is more responsive than the category average suggests.
Demand forecasting for price changes gives pricing leaders a structured way to test those consequences before a new price is published. It does not promise a precise prediction for every SKU and customer. Its value is more practical: it helps teams see likely demand movement, compare scenarios, identify material risks, and route decisions for review before margin or volume is affected.
For distributors and manufacturers managing large catalogs, the forecast must support a governed pricing decision. A demand number without the underlying cost, customer, product, and approval context is only another data point. The useful question is not simply, "Will units decline?" It is, "Which price action produces the best commercial outcome within our margin guardrails, customer commitments, and market conditions?"
Demand Forecasting for Price Changes Starts With a Baseline
A forecast needs a credible view of what demand would have been without the proposed price change. This baseline is more than last month's sales volume. It should account for normal seasonality, recent order patterns, customer-specific purchasing behavior, product availability, and known business events such as contract renewals or planned promotions.
For a catalog with recurring orders, a practical baseline may be the expected unit volume by SKU, customer segment, or account over the relevant period. For project-based or quote-driven business, the baseline may focus on expected win rates, quote volume, or the quantity attached to likely opportunities. The right unit of analysis depends on how the business actually sells.
Using a broad category average can be appropriate for low-value, low-volume items where detailed analysis would add little value. It is less appropriate for strategic products, high-revenue accounts, or items with a history of competitive switching. Forecasting effort should follow commercial exposure, not a desire to model every item with equal precision.
Build the baseline from connected operating data
The data required is familiar, but it is rarely organized for a single decision. Historical sales and demand provide the starting point. Current and planned costs establish the margin context. Existing price lists, customer agreements, quotes, and product attributes explain what customers are actually seeing. Inventory or availability data can prevent a shortage-driven decline from being mistaken for price sensitivity.
Teams should also distinguish between orders, shipments, returns, and quoted demand. A customer may reduce orders because an item was unavailable, a project was delayed, or a quote was lost for reasons unrelated to price. If those events are mixed into the history without context, the resulting forecast can overstate or understate price response.
A connected operating system is useful here because it makes the assumptions visible alongside the proposed action. NewAxiom brings demand, cost, price, and quote information into a controlled workflow so reviewers can assess a recommendation in its commercial context rather than reconcile separate reports.
Measure Price Response at the Right Level
Price elasticity is often described as a single number: the percentage change in demand associated with a percentage change in price. It is a useful concept, but applying one elasticity figure across an entire catalog creates false confidence.
Demand response varies by product, customer, channel, geography, order size, and the availability of alternatives. A proprietary replacement part may tolerate an increase that would sharply reduce demand for a comparable commodity. A customer buying for immediate operational need may behave differently from one purchasing for stock or a competitive bid.
The goal is not to create a complex elasticity model for its own sake. It is to select a level of detail that improves the decision. Many organizations can begin with product families and customer segments, then apply more specific assumptions to the items or accounts that represent the largest revenue, margin, or retention risk.
Historical price changes can provide evidence, but they require careful interpretation. Compare demand before and after a change while checking for changes in cost, availability, seasonality, competitive conditions, and customer agreements. A volume decline after a price update is not automatically proof that price caused it. Likewise, stable volume may reflect a temporary shortage of substitutes rather than durable customer acceptance.
When historical evidence is limited, commercial judgment belongs in the forecast. Category managers, sales leaders, and account teams often know where a customer is contractually constrained, where a competitor is active, or where a product is nearing replacement. Those inputs should be documented as assumptions, not left as informal commentary outside the approval record.
Compare Scenarios, Not Just One Proposed Price
The strongest use of demand forecasting is scenario comparison. Instead of asking whether a proposed price is correct, evaluate several defensible actions against the same baseline. This turns a difficult debate into a visible trade-off among revenue, gross margin dollars, gross margin rate, and expected units.
A team may compare a full cost pass-through, a partial increase designed to protect a strategic account, and a phased adjustment. Each scenario should show the proposed price, expected demand effect, resulting volume, revenue, cost, and margin outcome. Where applicable, it should also identify customers or products that need individual handling.
This matters because the highest price is not always the best decision. A larger increase can improve unit margin while reducing total margin dollars if volume falls enough. A smaller increase can be justified when it preserves a high-value relationship, supports a bundled sale, or avoids moving a customer into a competitor's price range. The forecast makes that trade-off explicit.
Test the assumptions that could change the decision
No forecast should present a single outcome as certain. For material price actions, use a base case and reasonable upside and downside cases. The downside case might assume greater customer switching, lower quote conversion, or a delayed recovery in demand. The upside case might reflect limited alternatives or strong acceptance among contract customers.
Sensitivity testing is especially useful when the decision is close. If a small change in expected volume makes the difference between improving and reducing gross margin dollars, the action deserves closer review or a more targeted rollout. If every reasonable scenario supports the same result, the team can proceed with greater confidence.
The forecast horizon should match the decision. A short-term price change may produce an initial order pull-forward followed by lower volume. An annual agreement may need a longer view that considers renewal risk and customer retention. There is no universal period that fits every price action.
Put Forecasts Into the Approval Process
Forecasting becomes operationally valuable when it changes how decisions are reviewed. Define who owns the assumptions, who can adjust the proposed price, which threshold triggers financial review, and who provides final approval. Without that structure, teams may debate the same exceptions repeatedly and lose the speed that forecasting was meant to provide.
A useful review record captures the proposed effective date, affected products and customers, baseline demand, scenario assumptions, expected margin impact, exceptions, and approvers. It should also preserve the final decision. That history helps teams improve later forecasts and explain why a particular action was taken.
Approval rules should reflect exposure. Routine changes within established guardrails may move quickly. Changes affecting key accounts, below-target margins, strategically sensitive categories, or unusually large demand risk should receive additional review. Governance is not a reason to slow every action. It is a way to apply attention where the commercial consequences are greatest.
Monitor What Happened After Execution
A demand forecast is a hypothesis that must be checked after prices take effect. Set a review window before publication and compare actual results with the baseline and forecast. Look at units, revenue, gross margin dollars, gross margin rate, order frequency, quote activity, and customer-level movement where relevant.
Do not react to the first week of results without context. Customers may place orders ahead of an effective date, draw down inventory, or adjust purchase timing. At the same time, do not wait so long that a clear problem becomes harder to correct. The review cadence should reflect order frequency and the size of the exposure.
When results differ from the forecast, identify why. The issue may be the demand assumption, but it could also be a missed customer exception, incorrect effective date, competitor response, inventory disruption, or a change in the product mix. Recording the cause improves future decisions more than simply replacing one elasticity assumption with another.
Where Forecasting Has Limits
Demand forecasting is less reliable when the business faces a major market disruption, a newly launched product, an abrupt competitive move, or limited historical transaction data. It is also difficult when several changes occur at once, such as a price update, sales incentive change, packaging revision, and supply constraint.
In these situations, the appropriate response is not to abandon forecasting. Use broader ranges, shorter review cycles, pilot changes where possible, and require more direct commercial input. A transparent estimate with visible uncertainty is more useful than a precise-looking number based on weak evidence.
The practical standard is not perfect prediction. It is better control over the decision before execution, and a disciplined way to learn from the result after it reaches the market.